Demand
Elasticity of Demand – a measure of how consumers react to a change in price
1. Elastic Demand: demand that is very sensitive to a change in price
- “Wants”
- Many substitutes
- Examples: Fur Coat, Soda, Steak
- Calculate: E > 1 (Greater than 1)
2. Inelastic Demand: demand that is not very sensitive to a change in price
- “Needs”
- Few to no substitutes
- Examples: Gas, Milk, Insulin, Soap
- Calculate: E < 1 (Less than 1)
- Calculate: E = 1 (Equal to 1)
- Keeps price from getting to high
- Example: Rent Control
- Below the equilibrium point on a price and quantity graph
- Consequences (if set to low):
- Lower prices for some consumers
- Shortage
- Long lines for buyers
- Illegal sales above the equilibrium price
Price floor – legal minimum price that is meant to help the seller
- Keep product prices from falling
- Example: Minimum Wage
- Above equilibrium point on a price and quantity graph
- Consequences:
- Higher product prices
- Surplus
- Higher taxes
- Waste
Supply
- The law of supply states that a higher price leads to a higher quantity supplied and that a lower price leads to a lower quantity supplied.
- Supply curves and supply schedules are tools used to summarize the relationship between supply and price.
Supply schedule and supply curve:
- A supply schedule is a table that shows the quantity supplied at each price.
- A supply curve is a graph that shows the quantity supplied at each price.
Price (per gallon) Quantity supplied (millions of gallons)
A supply curve for gasoline

The supply curve is created by graphing the points from the supply schedule and then connecting them. The upward slope of the supply curve illustrates the law of supply—that a higher price leads to a higher quantity supplied, and vice versa.
Nearly all supply curves, however, share a basic similarity: they slope up from left to right and illustrate the law of supply. Conversely, as the price falls, the quantity supplied decreases.
| Price (per gallon) | Quantity supplied (millions of gallons) |
|---|---|
A supply curve for gasoline
The supply curve is created by graphing the points from the supply schedule and then connecting them. The upward slope of the supply curve illustrates the law of supply—that a higher price leads to a higher quantity supplied, and vice versa.
The difference between supply and quantity supplied
In economic terminology, supply is not the same as quantity supplied. When economists refer to supply, they mean the relationship between a range of prices and the quantities supplied at those prices—a relationship that can be illustrated with a supply curve or a supply schedule. When economists refer to quantity supplied, they mean only a certain point on the supply curve, or one quantity on the supply schedule. In short, supply refers to the curve, and quantity supplied refers to a specific point on the curve.
Market Equilibrium
Key points
- Supply and demand curves intersect at the equilibrium price. This is the price at which the market will operate.
Intersecting supply and demand curves
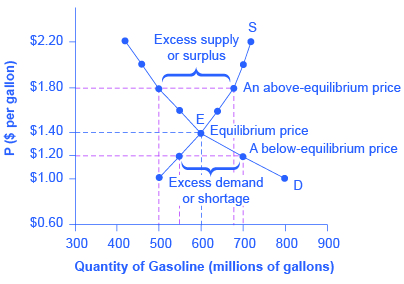
Price per gallon Quantity supplied in millions of gallons Quantity demanded in millions of gallons
The equilibrium price is the only price where the plans of consumers and the plans of producers agree—that is, where the amount consumers want to buy of the product, quantity demanded, is equal to the amount producers want to sell, quantity supplied. This common quantity is called the equilibrium quantity. At any other price, the quantity demanded does not equal the quantity supplied, so the market is not in equilibrium at that price.
Intersecting supply and demand curves
| Price per gallon | Quantity supplied in millions of gallons | Quantity demanded in millions of gallons |
|---|---|---|


Loved the detailed descriptions and caption! Definitely made it easier to grasp the content. However, I would improve the structure of some notes; instead of writing paragraphs stick to bullets to keep your audiences attention. Also "price ceiling" and "price floor" should be under the business cycle post.
ReplyDelete