Monday, February 26, 2018

Unit Two: Unemployment

Vocabulary:

Unemployment - failure to use available resources, particularly labor, to produce desired goods and services

Population - number of people in a country

Labor Force - number of people in a country that are classified as either employed or unemployed


Groups of People:

Employed


  • 16 years of age or older, that have a job
  • Must work at least an one hour, every two weeks

Unemployed

  • People who are 16 years of age or older, who do not have a job
  • Have actively searched for a job in the last two weeks 
Not in the Labor Force

  • Kids
  • Full-Time Students
  • Retirees
  • Disabled
  • Mentally Institutionalized People
  • Incarcerated People
  • Military
  • Homemakers (Stay at home and take care of house/children)
  • Discouraged Workers 

Formulas:

Unemployment Rate = (# of Unemployed) / (Total Labor Force) X 100

Total Labor Force = (# of Unemployed) + (# of Employed)


Types of Unemployment:

Frictional 

  • People are temporarily unemployed, or "in between" jobs
  • Individuals are qualified workers with transferable skills
  • People who have a high school or college degree
  • Want to find a better opportunity


Structural

  • Changes in the structure of the labor force make some skills obsolete 
  • Workers do not have transferable skills 
  • Example: VCR Repairman, Typewriter Repairman
  • Creative Destruction - as new jobs are created, old jobs are lost

Seasonal

  • Work a certain time of the year
  • Jobs will come back
  • Examples: Lifeguards, Construction Workers, School-Bus Drivers, Santa, Easter Bunny 


Cyclical 

  • Unemployment that results from economic downturns in the economy
  • As demand for goods/services falls, demand for labor falls, and workers are laid off
  • Example: Recession

Full Employment

  • 4 to 5 % unemployment
  • Only way to get it is if there is no cyclical unemployment 

NRU (Natural Rate of Unemployment) = Frictional +  Structural Unemployment


Okun's Law

  • For every 1% by which the actual unemployment rate exceeds the natural rate of unemployment, Real GDP will fall by 2%

Rule of 70

  • The number of years it takes for GDP to double
  • Example: If the annual inflation rate is 2%, then how many years will it take for GDP to double? 70/2 = 35 Years




Monday, February 19, 2018

Unit Two: Inflation


Inflation

  • Reduces the purchasing power of money 
  • When inflation occurs, each dollar of income will buy fewer goods than before

Demand-Pull Inflation 

  • Too many dollars chasing too few goods
  • Demand pulls of prices

Cost-Push Inflation

  • Higher production cost, increases prices

Causes of Inflation:

  1. Government prints too much money:
    • Governments that keep printing money to pay debts end up with a condition called hyper-inflation
  2. d
  3. d

Monday, February 12, 2018

Unit Two: GDP

Gross Domestic Product (GDP)


Total market value of all final goods and services produced within a country's borders within a given year
  • What's not included
    • Gross National Products
    • Used or Second-hand Goods (trying to avoid double or multiple counting)
    • Gifts/Transfer Payments
      • Public: Welfare, Social Security
      • Private: Scholarship
      • No Output is Being Produced
      • Recipients Contribute Nothing to Current Production 
    • Stocks and Bonds
      • Purely Financial Transactions
      • No Current Production 
    • Unreported Business Activities 
      • Example: Tips
    • Illegal Activities
      • Examples: Drugs, Prostitution, etc. 
    • Intermediate Goods - goods that require further processing before they are ready for final use
    • Non-Market Activity 
      • Examples: Volunteer Activity, Family Work, Babysitting

(Expenditure Approach to GDP): 

  • Formula: C + Ig + G + Xn
    • C = Personal Consumption Expenditures 
      • Durable and Non-Durable Goods
      • 67% of the Economy
      • Ex: Saving More Money, Rent
    • Ig = Gross Private Domestic Investment
      • New Factory Equipment 
      • Factory Equipment Maintenance 
      • Construction of Housing
      • Unsold Inventory of Products Build in a Year
      • Ex: Business Inventories
    • G = Government Spending 
    • X= Net Exports
      • (Exports - Imports)

    Gross National Product (GNP) - sum of all goods and services produced by residents of a country during a given year

    Expenditure Approach 

    • Add up all the spending on final goods and services produced in a given 
    • FormulaC + Ig + G + Xn 
    • Based on Receipts 

    Income Approach 

    • Add up all the income that resulted from selling all final goods and services produced in a given year
    • Formula
      • W - Wages (Salary, Salary Supplements, Compensation of Employees)
      • R - Rents (Rental Income)
      • I - Interests (Interests Income)
      • P - Profits (Proprietor's Income)
      • + (plus)
      • Statistical Adjustments 
    • Based upon the verbalization of something 

    • Whatever you get for the Expenditure Approach has to equal the Income Approach 

    Trade Formula: (Exports - Imports)

    • Positive: Surplus
    • Negative: Deficit 

    Budget Formula:
    (Government Purchases of Goods and Services + Government Transfer Payments - Government Tax and Fee Collections)

    • Positive: Deficit
    • Negative: Surplus

    National Income: 

    Option 1:
    (Compensation of Employees + Rental Income + Interest Income + Proprietor Income + Corporate Profits)

    Option 2:
    (GDP - Indirect Business Taxes - Depreciation (Consumption of Fixed Capital) - Net Foreign Factor Payments) 


    Disposable Personal Income: 

    National Income - Personal Household Taxes + Government Transfer Payments


    Net Domestic Product: 

    (GDP - Depreciation)


    Net National Product:  

    (GNP - Depreciation)


    Gross National Product: 

     (GDP + Net Foreign Factor Payments)


    Gross Private Domestic Investment (Ig):

    (Net Private Domestic Investment + Depreciation) 


    Nominal GDP:


    • The value of output produced in current year prices. 
    Formula: Price x Quantity 
    • Use price and quantity for designated years


    Real GDP:


    • The value of output produced in constant base year (original year)
    • Prices that is adjusted for inflation 
    Formula: Price x Quantity 
    • Use the price from the base year
    • Use the quantities from the designated years


    Wednesday, February 7, 2018

    Unit Two: Circular Flow


    • Household - Person or a group of people who share an income
    • Firms - organization that produces good and services for sale
    • Factor (Resource) Market - market in which the factors of production are bought by firms and sold by households
    • Product Market - where goods and services are bought and sold

    Factor Payments

    • Land - Rents
    • Labor - Wages
    • Capital - Interests 
    • Entrepreneurship - Profits


    Saturday, February 3, 2018

    Unit One: Macroeconomic Issues: Business Cycle, Unemployment, Inflation, Growth


    Business Cycle

    • It is the fluctuation in economic activity that an economy experiences over a period of time 

    Expansion

    • it is a period when you experience high real GDP and high employment 

    Peak

    • It is the highest point just before the unemployment rate rises 

    Contraction/Recession

    • real GDP decreases, and unemployment is high 

    Trough

    • lowest point, and often called a depression


    Video: 
    https://www.youtube.com/watch?v=QAZuCXkvU2k

    Thursday, February 1, 2018

    Unit One: Demand, Supply, and Market Equilibrium

    Demand


    Elasticity of Demand – a measure of how consumers react to a change in price

    1. Elastic Demand: demand that is very sensitive to a change in price
    • “Wants” 
    • Many substitutes 
    • Examples: Fur Coat, Soda, Steak 
    • Calculate: E > 1 (Greater than 1) 
    2. Inelastic Demand: demand that is not very sensitive to a change in price 
    • “Needs” 
    • Few to no substitutes 
    • Examples: Gas, Milk, Insulin, Soap 
    • Calculate: E < 1 (Less than 1) 
    3. Unit/Unitary Elastic:
    • Calculate: E = 1 (Equal to 1)

    Price Ceiling – legal maximum price meant to help buyers
    • Keeps price from getting to high
    • Example: Rent Control
    • Below the equilibrium point on a price and quantity graph
    • Consequences (if set to low):
      • Lower prices for some consumers
      • Shortage
      • Long lines for buyers
      • Illegal sales above the equilibrium price

    Price floor – legal minimum price that is meant to help the seller
    • Keep product prices from falling
    • Example: Minimum Wage
    • Above equilibrium point on a price and quantity graph
    • Consequences:
      • Higher product prices
      • Surplus
      • Higher taxes
      • Waste 


    Supply 

    • The law of supply states that a higher price leads to a higher quantity supplied and that a lower price leads to a lower quantity supplied.
    • Supply curves and supply schedules are tools used to summarize the relationship between supply and price.

    Supply schedule and supply curve:

    • A supply schedule is a table that shows the quantity supplied at each price.
    • A supply curve is a graph that shows the quantity supplied at each price.
    Here's an example of a supply schedule from the market for gasoline:

    Price (per gallon)Quantity supplied (millions of gallons)
    dollar sign, 1, point, 00500
    dollar sign, 1, point, 20550
    dollar sign, 1, point, 40600
    dollar sign, 1, point, 60640
    dollar sign, 1, point, 80680
    dollar sign, 2, point, 00700
    dollar sign, 2, point, 20720
    A supply curve for gasoline

    The graph shows an upward-sloping supply curve that represents the law of supply.
    The supply curve is created by graphing the points from the supply schedule and then connecting them. The upward slope of the supply curve illustrates the law of supply—that a higher price leads to a higher quantity supplied, and vice versa.
    Nearly all supply curves, however, share a basic similarity: they slope up from left to right and illustrate the law of supply. Conversely, as the price falls, the quantity supplied decreases.


    The difference between supply and quantity supplied

    In economic terminology, supply is not the same as quantity supplied. When economists refer to supply, they mean the relationship between a range of prices and the quantities supplied at those prices—a relationship that can be illustrated with a supply curve or a supply schedule. When economists refer to quantity supplied, they mean only a certain point on the supply curve, or one quantity on the supply schedule. In short, supply refers to the curve, and quantity supplied refers to a specific point on the curve.

    Market Equilibrium 

    Key points

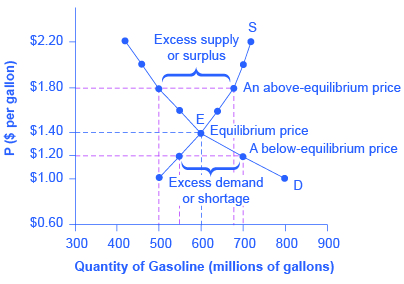
    • Supply and demand curves intersect at the equilibrium price. This is the price at which the market will operate.

    Intersecting supply and demand curves

    The graph shows the demand and supply for gasoline where the two curves intersect at the point of equilibrium.
    Price per gallonQuantity supplied in millions of gallonsQuantity demanded in millions of gallons
    dollar sign, 1, point, 00500800
    dollar sign, 1, point, 20550700
    start color red, dollar sign, 1, point, 40, end color redstart color red, 600, end color redstart color red, 600, end color red
    dollar sign, 1, point, 60640550
    dollar sign, 1, point, 80680500
    dollar sign, 2, point, 00700460
    dollar sign, 2, point, 20720420
    The equilibrium price is the only price where the plans of consumers and the plans of producers agree—that is, where the amount consumers want to buy of the product, quantity demanded, is equal to the amount producers want to sell, quantity supplied. This common quantity is called the equilibrium quantity. At any other price, the quantity demanded does not equal the quantity supplied, so the market is not in equilibrium at that price.


    Comparative and Absolute Advantage

    Absolute Advantage  Who can produce more with the same resources Who can produce most output with less resources Example: Produce 100...